Drupal 6: Integrating Open Flash Charts into a Drupal View
In this tutorial I’ll show how I integrated Open Flash Charts into a Drupal view to create a fancy flash based chart from CCK node data.
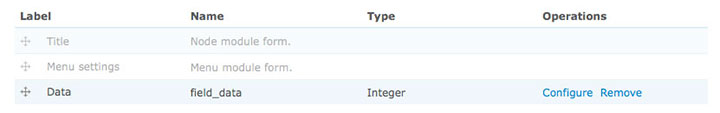
Let’s start by creating a new CCK node type to contain the data. I called mine “graph_data”.

I added an integer field called “field_data”.
I created a bunch of nodes, populating them with a random integer from 0 to 100.
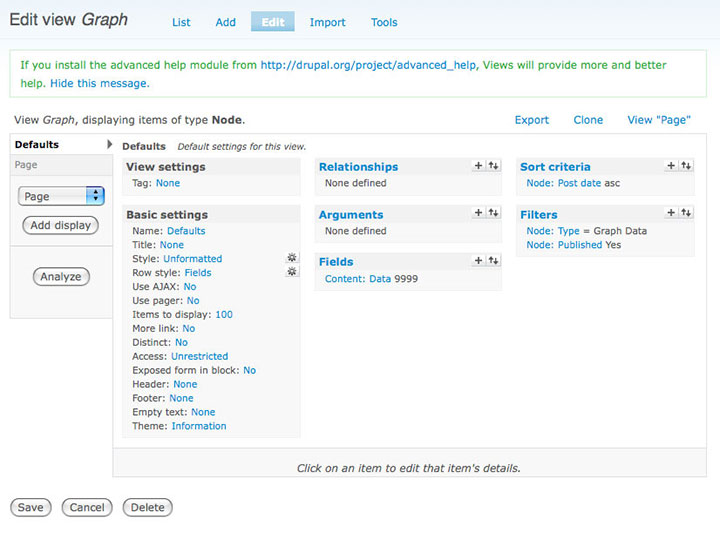
I added a view called “Graph” to show all of my data. I filtered by node type and published, added sort criteria, chose “Unformatted” for Style, chose how many items to show (100), and added a page view.
At this point, you’ll need to download and incorporate the Open Flash Charts library. You can download the library here or by visiting their website and clicking on Downloads in the top right. Uncompress the download and copy the entire directory (version-2-ichor) into your theme directory.
Sample directory structure:
/sites/all/themes/YOURTHEME/version-2-ichorI created a new file in my theme directory called “views-view-unformatted–Graph.tpl.php” (see: Theme Information section on the View edit page) to override it’s output. I put the guts of my code in this file:
<?php
// loop through the view results and populate a numeric array
$values = array();
foreach ($view->result as $k => $v) {
$values[] = intval($v->node_data_field_data_field_data_value);
}
// include OFC PHP library
require_once(path_to_theme() . '/version-2-ichor/php-ofc-library/open-flash-chart.php');
// create a new line object
$line = new line();
// set the view values to the line object
$line->set_values( $values );
// create a new flash object
$chart = new open_flash_chart();
// add the line object to the chart object
$chart->add_element( $line );
// create a new x_axis object
$x = new x_axis();
// set the number of steps
$x->set_steps(10);
// add the x_axis object to the chart
$chart->set_x_axis($x);
// create a new y_axis object
$y = new y_axis();
// set the range of the y axis, based on the min/max view values
$y->set_range(min($values),max($values));
// set the number of steps
$y->set_steps(10);
// add the y_axis object to the chart
$chart->set_y_axis($y);
?>
<!-- Include Javascript libraries -->
<script type="text/javascript" src="<?php print base_path() . path_to_theme(); ?>/version-2-ichor/js/json/json2.js"></script>
<script type="text/javascript" src="<?php print base_path() . path_to_theme(); ?>/version-2-ichor/js/swfobject.js"></script>
<script type="text/javascript">
swfobject.embedSWF("<?php print base_path() . path_to_theme(); ?>/version-2-ichor/open-flash-chart.swf", "my_chart", "350", "200", "9.0.0");
</script>
<!-- Add Javascript to initialize the chart and load its data -->
<script type='text/javascript'>
function open_flash_chart_data() {
return JSON.stringify(data);
}
function findSWF(movieName) {
if (navigator.appName.indexOf("Microsoft")!= -1) {
return window[movieName];
} else {
return document[movieName];
}
}
// output the graph data into a javascript variable
var data = <?php echo $chart->toPrettyString(); ?>;
</script>
<!-- Output a container div for the chart -->
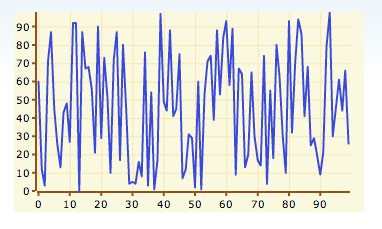
<div id="my_chart"></div>Here’s a screenshot of my new flash integrated view: